Demographic Transition Model
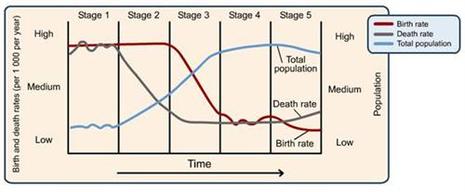
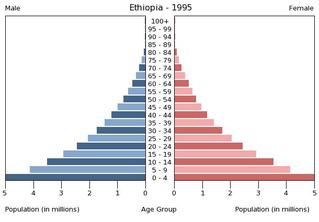
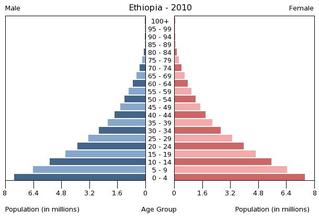
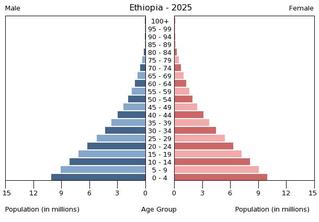
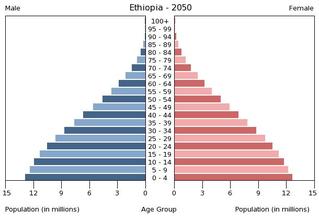
The statistics of Ethiopia's population show that they are currently in stage 2. The birth rate is high and the death rate is low which means there's going to be high growth in the population of Ethiopia. The population pyramids indicate there is a large young population in Ethiopia, so that's how you can tell the birth rate is high. They also show very little difference throught the decades, the only thing that's different is the population is getting larger. That is why I think Ethiopia is in stage 2 of the Demographic Transition Model.
|
Population (Mid 2012): 86,960,000
Density (people per sq. km): 79 Net Migration Rate (#per 1000 people): -1 Birth Rate (# per 1000 people): 34 Death Rate (# per 1000 people): 10 Rate of Natural Increase: 2.4% Population Growth Rate: 3% Infant Mortality Rate (# of deaths per 1000 live births): 59 Total Fertility Rate (average # of children per woman): 4.8 Population Age <15 %: 41% Population Ages 65+ %: 3% Dependency Rate (add together Population Age <15 % and Ages 65+ %): 44% Life Expectancy at Birth (Total): 56 Life Expectancy at Birth Females: 57 Life Expectancy at Birth Males: 54 Primary School Completion Rate Females: 53% Primary School Completion Rate Males: 57% Secondary School Enrollment Net Females: 11% Secondary School Enrollment Net Males: 17% GNI PPP per capita in US$: $930 Population Living Below US$2 per day: 78% Economically Active Females 15+: 81% Economically Active Males 15+: 90% Mobile Phone Subscribers (# per 1000): 2 Motor Vehicles (# per 1000): 2 Undernourished Population: 46% Underweight Children Under Age 5: 33 HIV/AIDS Among People Ages 15-49: N/A |
|
